| |
| What is the Land Cover Map of Catalonia? |
The Land
Cover Map of Catalonia (MCSC) is a high resolution thematic
cartography of the main types of land cover of the country (forests, crops, urban areas,
etc.). The MCSC is carried out in the Centre de Recerca Ecolňgica i
Aplicacions Forestals (CREAF), with the funding of the Generalitat de
Catalunya.
El MCSC is part of the Internet available Cartography of the Generalitat de Catalunya and is, therefore, free to use.
The MCSC is presented in digital format. The different areas are delimited by photointerpretation and digitalization on computer screen, using the MiraMon GIS.
![]()
The Land
Cover Map of Catalonia: Why?
In recent decades, changes in land covers and soil uses have sped up. These changes produces impacts on the environment and the landscape.
Every territorial management or planning that tries to avoid or resolve these problems, necessarily requires the cartography, the snapshot, but also the evolution of land uses and land covers, and changes in landscape structure.
The MCSC is a basic cartography of the land covers that, which currently has four editions. Thanks to the different editions of the MCSC, will be possible to know, among other things, if the forestry area increases or decreases, or if the urban pressure affects non-suitable territories for this use.
![]()
What is
the Land Cover Map of Catalonia for?
![]()
What is
the legend of the Land Cover Map?
The
MCSC is a digital product
that covers the main types of land
covers, with a hierarchical legend of 2 levels and 1 sublevel for the
first edition, 3 levels and 1 sublevel for the second edition, and 5
levels and 1 sublevel for the third and fourth edition. In order to
obtain such a legend, a part of the categories included in the upper
levels are subdivisions of categories of the lower levels. It can
be consulted the full table in the document: Table from level 1 to 5.
![]()
Interpretation
of the legend of the different editions
![]()
What are
the characteristics of the MCSC?
The
Table 1, shows the scale and resolution of the orthophotos and the
working scale used in the different editions of the MCSC. It also
indicates the availability of orthophotos in infrared colour, a
very useful material for identifying different types of forests and
crops.
| MCSC-1 1993 |
MCSC-2 2000-2002 (incomplete) |
MCSC-3v1 and MCSC-3v2 2005-2007 |
MCSC-4 2009 |
|
| Orthophotos
scale |
1:25.000 |
1:5.000 |
1:5.000 |
1:2.500 |
| Resolution
(pixel) |
2.5
m |
0.50
m |
0.5
m |
0.25
m |
| Working
scale |
1:3.000 |
1:1.500 |
1:1.500 |
1:1.000 |
| Infrared
colour |
No |
No |
Yes (SPOT) | Yes
(ortofoto) |
The
table 2, shows the surface and the minimum width of capture, as well
as, the number of categories and levels of the legend for each of the
editions of the MCSC.
| MCSC-1 1993 |
MCSC-2 2000-2002 (incomplete) |
MCSC-3v1 and MCSC-3v2 2005-2007 |
MCSC-4 2009 |
|
| Minimum
surface of capture |
500
m˛ |
500
m˛ |
500 m˛ | 500 m˛ |
| Minimum
width |
10
m |
10m Communication network: 8 m |
10m Cataloged communication network: No limits Non-catalogued roads: 15 m |
Idem.
2005-2007 |
| Categories |
24 |
61 |
v1:
233 v2: 241 |
241 |
| Levels
of the hierarchical legend |
2 |
3 |
5 |
5 |
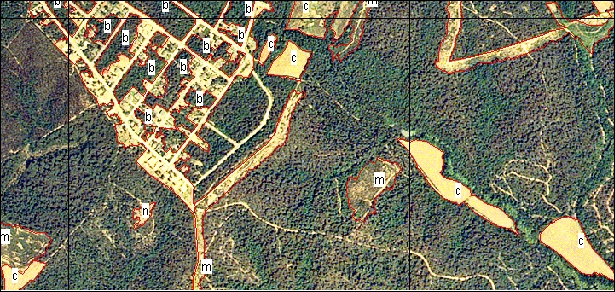
The cartographic basis obtained through this process (boundary lines and identification labels for the covers, figure 1), is devided in sheets that follows the cartographic sections 1:25 000.
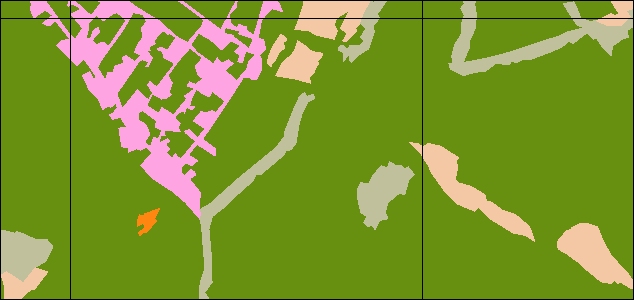
Afterwards, is converted to a format of topológically structured vectors (polygons) (figure 2), thus:
This map also is converted to a raster format (image where the spatial representation is made by a space division in a grid of squares, called cells or pixels), with a planimetric resolution of 2 m per pixel. Despite its high detail, the raster image is converted to a compressed version, obtaining smaller files and more agile queries. The raster images also allow interactive queries by attribute and location and calculate the area of one or more land covers. In addition to being a very handy format in GIS analysis.
Among the operations that are possible to do on the MCSC basis we mention the thematic reclassification in order to obtain more general categories, distance calculation between graphic objects, cross-classification between layers, etc.The selected items in a query on any of these digital formats can be exported to another file, obtaining a new geographical database.
The MCSC is used by several public government institutions, not only in its original format , but as a highly accurate planimetric basis on which other applications or studies are carried out (fuel models and flammability maps, vegetation maps, etc.)
The
MCSC has improved technical characteristics over the different
editions, in proportion to the quality of the images of the different
flights, so that the information in each new edition is more complete,
accurate and reliable.
The volumes of the Ecological and Forest Inventory of Catalonia include the land cover areas of the first MCSC edition for each forest region in which the catalan territory is devided, at level municipal, county and Interest Natural Areas, as well as the land cover distribution in function of the altitude, the slope, and the orientation.
![]()
Main
Bibliography on the methodology of the MCSC
IBŔŃEZ, J.J.; BURRIEL, J.A.; & PONS, X. (2002). El mapa de cobertes del sňl de Catalunya: una eina per al coneixement, la planificació i la gestió del territori. Perspectivas Territorials. 3: 10-25. Departament de Política Territorial i Obres Públiques, Generalitat de Catalunya. Barcelona.
BURRIEL, J.A.; IBŔŃEZ, J.J.; & PONS, X. (2005). Segunda edición del mapa de cubiertas del suelo de Cataluńa: Herramienta para la gestión sostenible del territorio. Cuadernos de la Sociedad Espańola de Ciencias Forestales 19: 35-39.
IBŔŃEZ,
J.J. & BURRIEL, J.A.
(2010): Mapa de cubiertas del suelo de
Cataluńa: características de la tercera edición y relación con SIOSE.
En: Ojeda, J., Pita, M.F. y Vallejo, I. (Eds.), Tecnologías de la
Información Geográfica: La Información Geográfica al servicio de los
ciudadanos. Secretariado de Publicaciones de la Universidad de Sevilla.
Sevilla. Pp. 179-198. ISBN: 978-84-472-1294-1
| Links to other combinable carthografy |
The
Land Cover Map sheets can be combined with other geographical
information in digital format in order to complete the analysis. Below
are some links to other sources of cartography:
The Land Cover Map sheets are only served on digital support. The available formats are:
If you are interested on the sheets of a bigger particular geographic area that is not offered in the MCSC website (provinces, natural parks,...) please contact: joan.pino@uab.cat
Download
MCSC data: MCSC first
edition (basis images of 1993): MCSC third
edition, version 1 (basis images of 2005-2007): MCSC
second edition (basis images of 2000-2003):

![]()
Vectors
(polygons)
Rasters (images)
MCSC
third edition, versión 2 (basis images of 2005-2007):
By
administrative boundaries (polygons)
Vectors
(polygons)
By
administrative boundaries (rasters)
Rasters
(images)
MCSC fourth edition
(basis images of 2009):
Vectors (polygons)
Rasters
(images)
Go to SIBosC web